MK-Portfolio
Data Analyst Portfolio
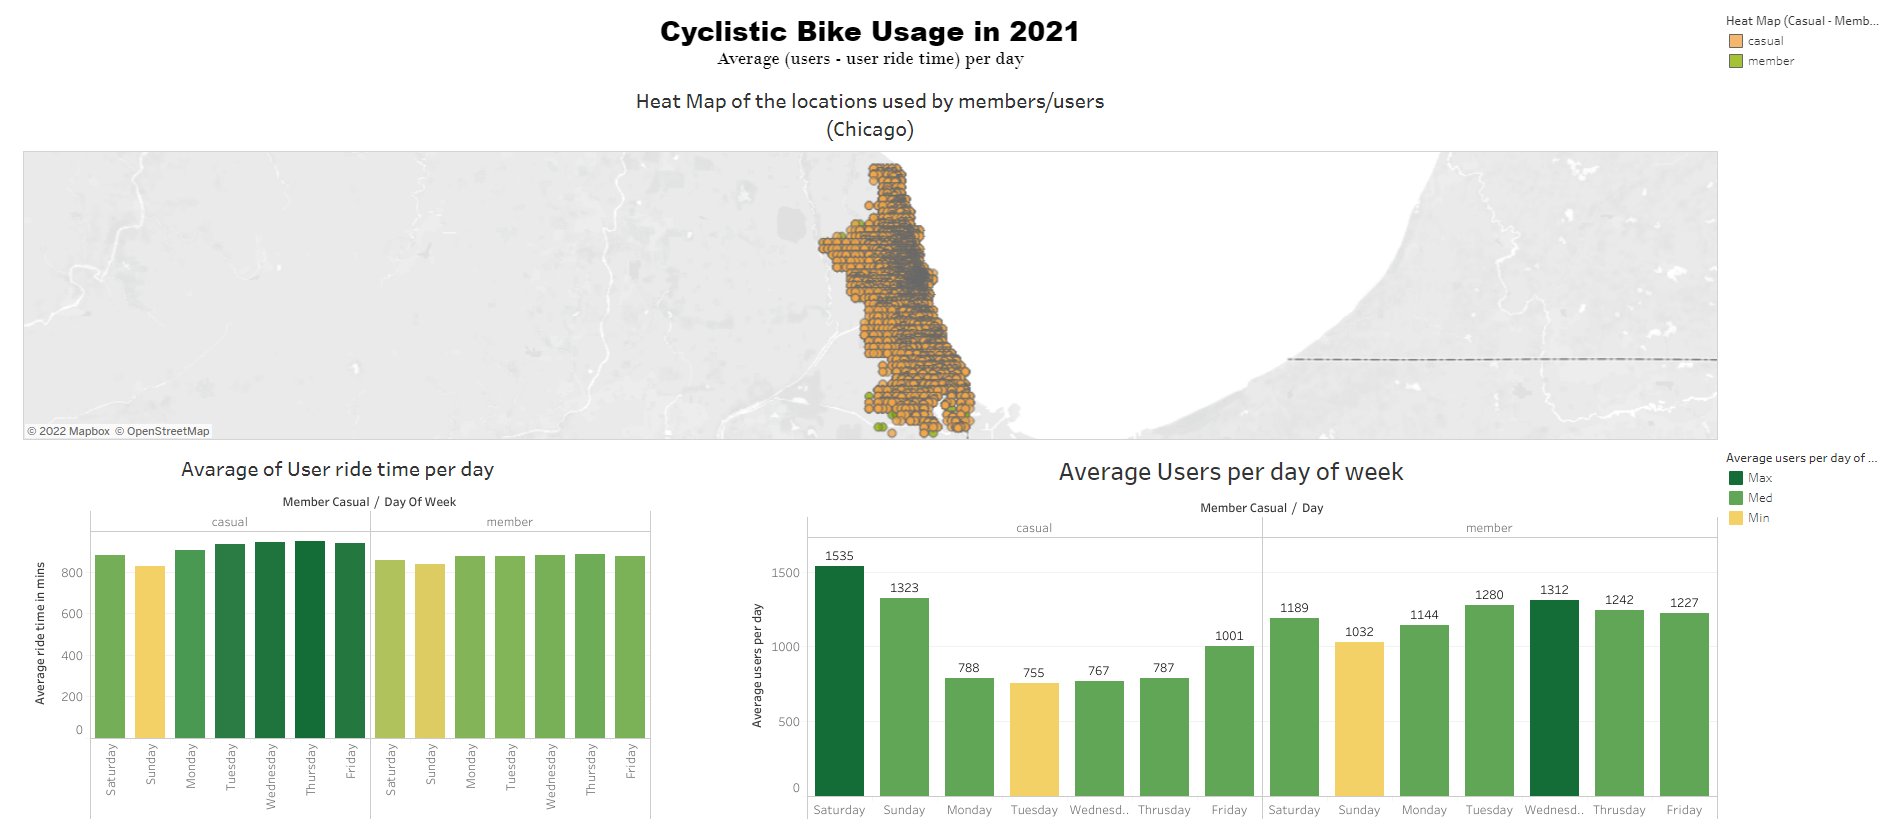
Project 1: Google Data Analytics Capstone Project (Bike-Share Company Future Success)
- Organized, sorted, and saved data in a way to help make the data easier to understand and access.
- Gone through more than 5 million rides per year over 12 tables to insure the credibility and integrity of the data.
- Filtered, sorted, organized, and cleaned data to insure that the data is not bias.
- Used BigQuery (SQL) as the analysis tool which better works with large datasets.
- Analyzied data to get the optimum outcome from the available data to answer the business questions.
- Used tableau as my data visualization tool to show insights and trends.
- Gave recommendation which depends on the facts from the data.
Dashboard (Average User Usage & Ride Time)
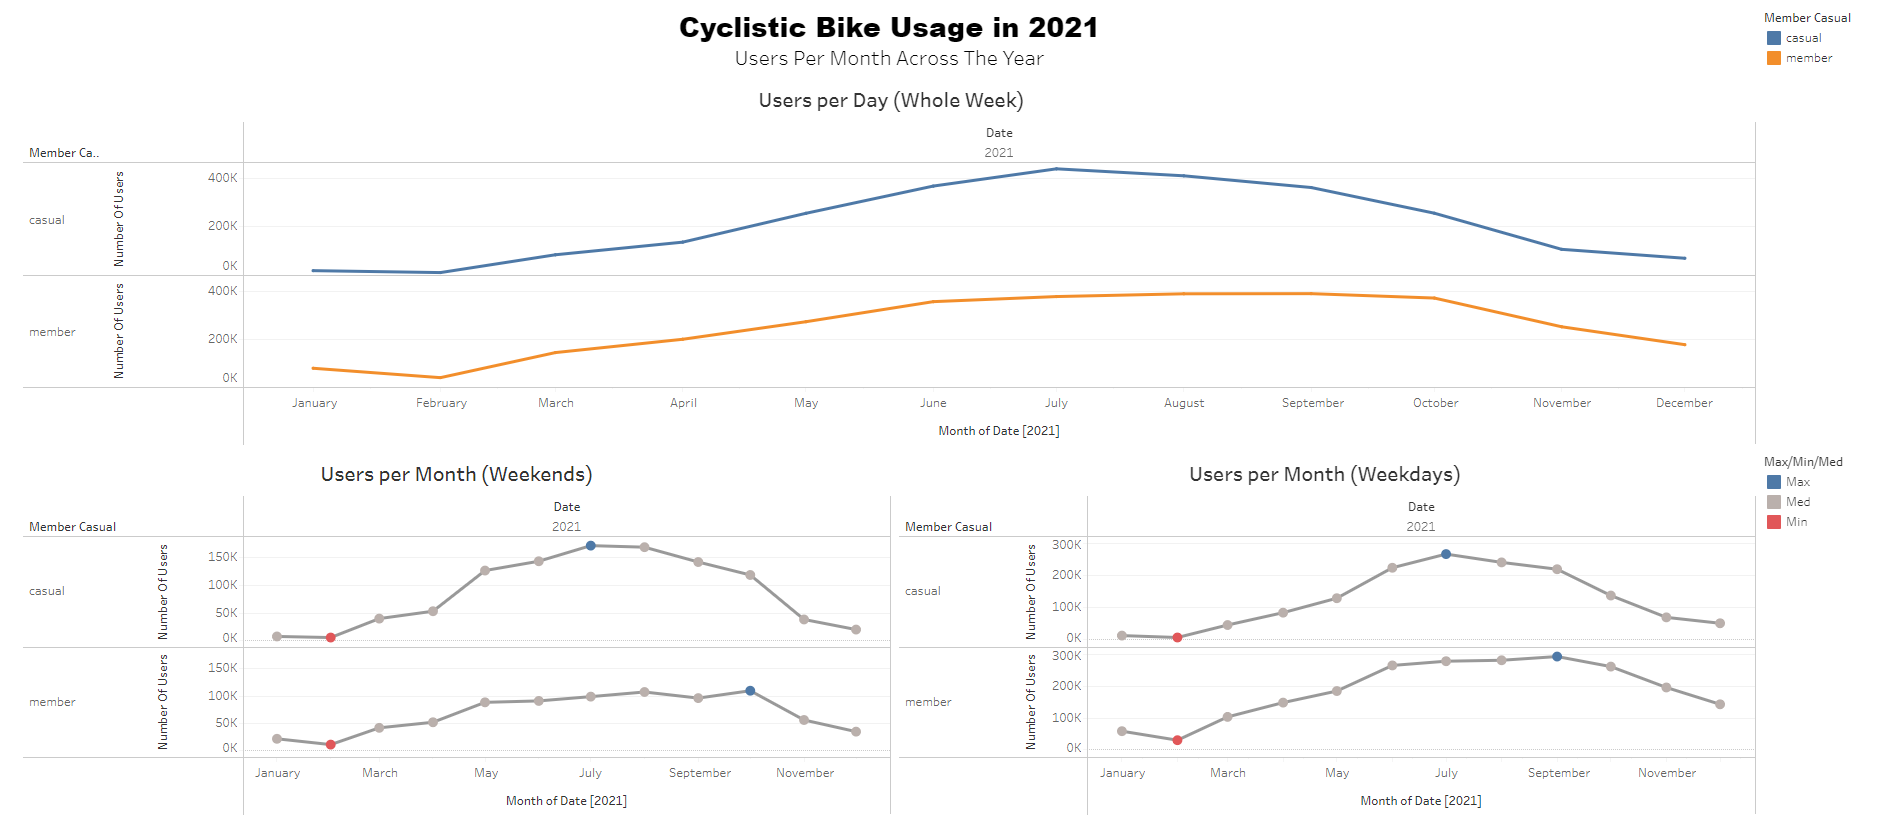
Dashboard (Users Usage Thoughout The Year)
Project 2: Covid-19 Data Exploration
- Explored the data using Microsoft SQL Server which gave me a new software to use and explora data with.
- Viewed the data to get a better understanding of it and what can I get from it so I can tell a story using a visualization tool.
- After viewing the data I found more than one way to get some useful information like new deaths, new cases, new vaccination ,etc. .
- Sorted, organized and made more than one table experssing the useful information in the dataset.
Project 3: Covid-19 Data Visualization
- After Explorating the data in Project 2 now it is time get some table from the queries to show the findings
- Made to Vizualizations each for Covid-19 Deaths and Covid-19 Vaccination.
- The data used from those queries would make us better understand what happend to the continent/countries(Location in the dataset)
- Used Tableau as the data vizualization tool to show findings and differences between continent/countries and how they dealt with the pandemic
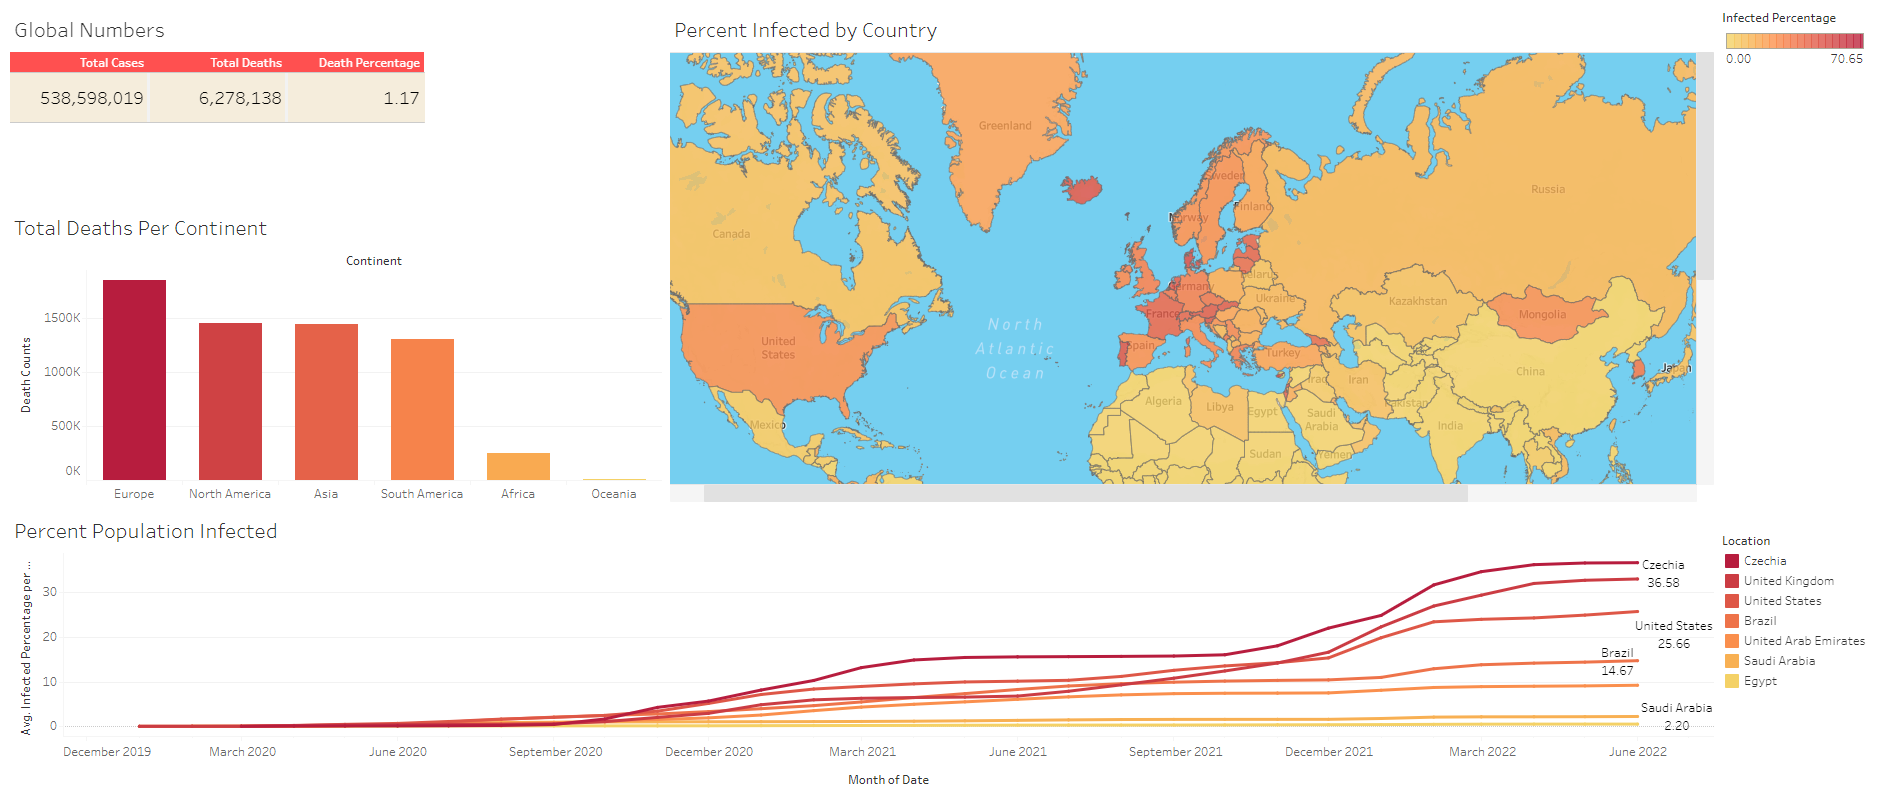
Dashboard (Covid-19 Deaths)
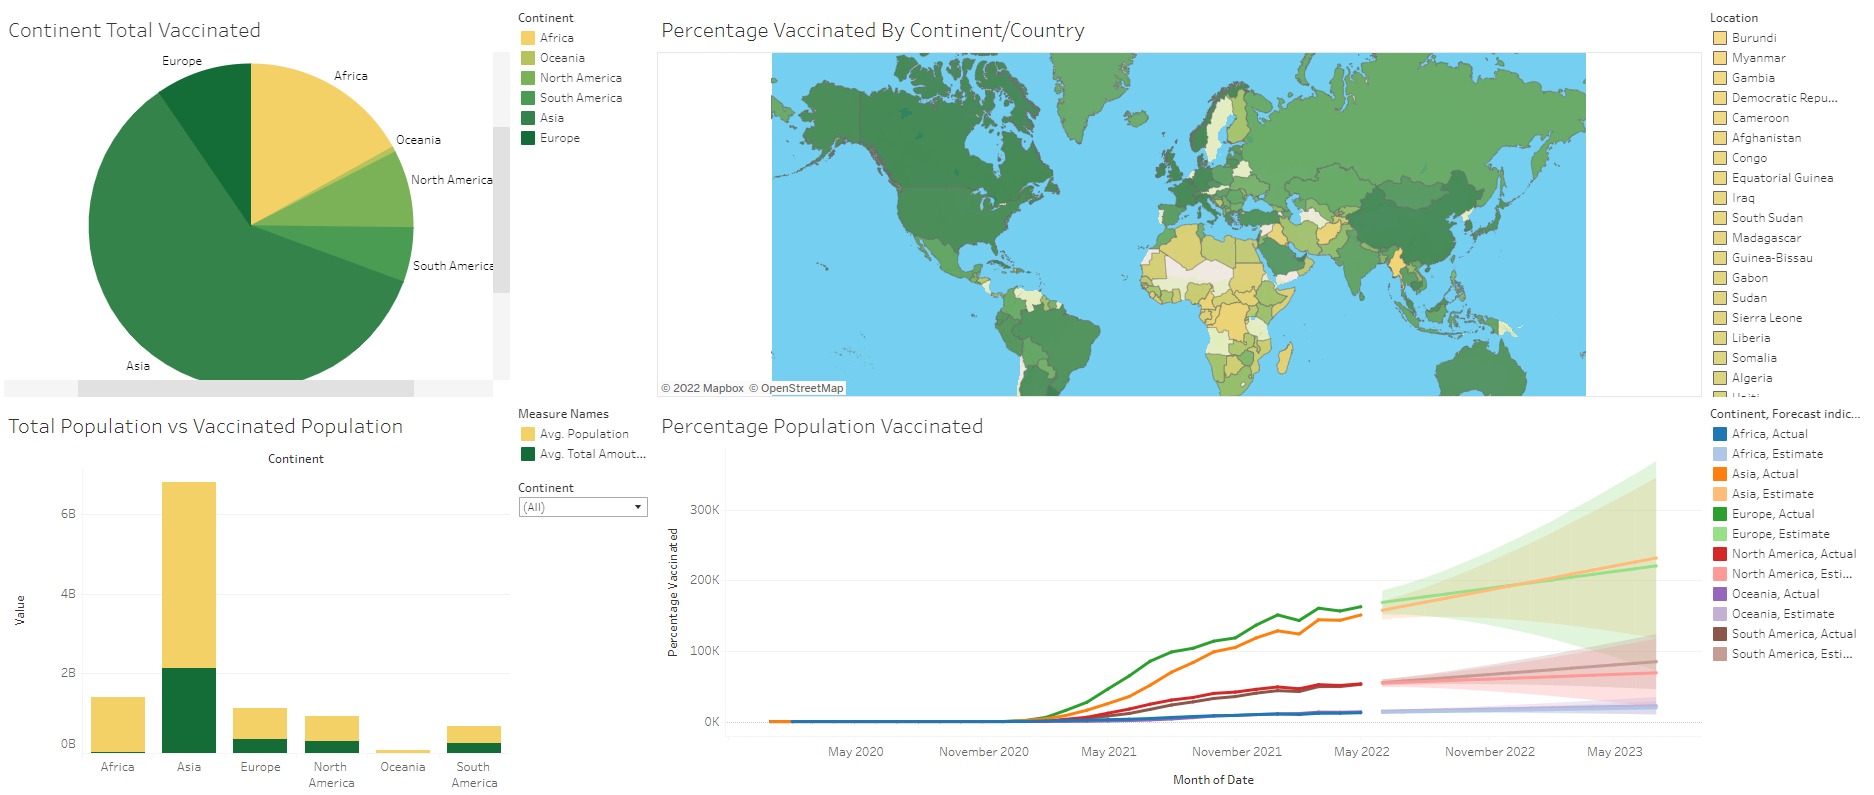
Dashboard (Covid-19 Vaccination)
Project 4: Nashville Housing Data Cleaning
- Used Microsoft SQl Server to clean the data
- Converted data type to a suitable type to ensure it proper usage
- Populated missing data from the data itself to ensure crediblity
- Broke out columns into new individual columns for more precise results
- Created new Columns for the new ones
- Changed data withen a colmun to match like ‘Y and N to Yes and No’ so that the data matchs along each attribute
- Found and removed duplicates so there is no bias in the data
- Deleted unused columns to make ot more simple and fast while analyzing
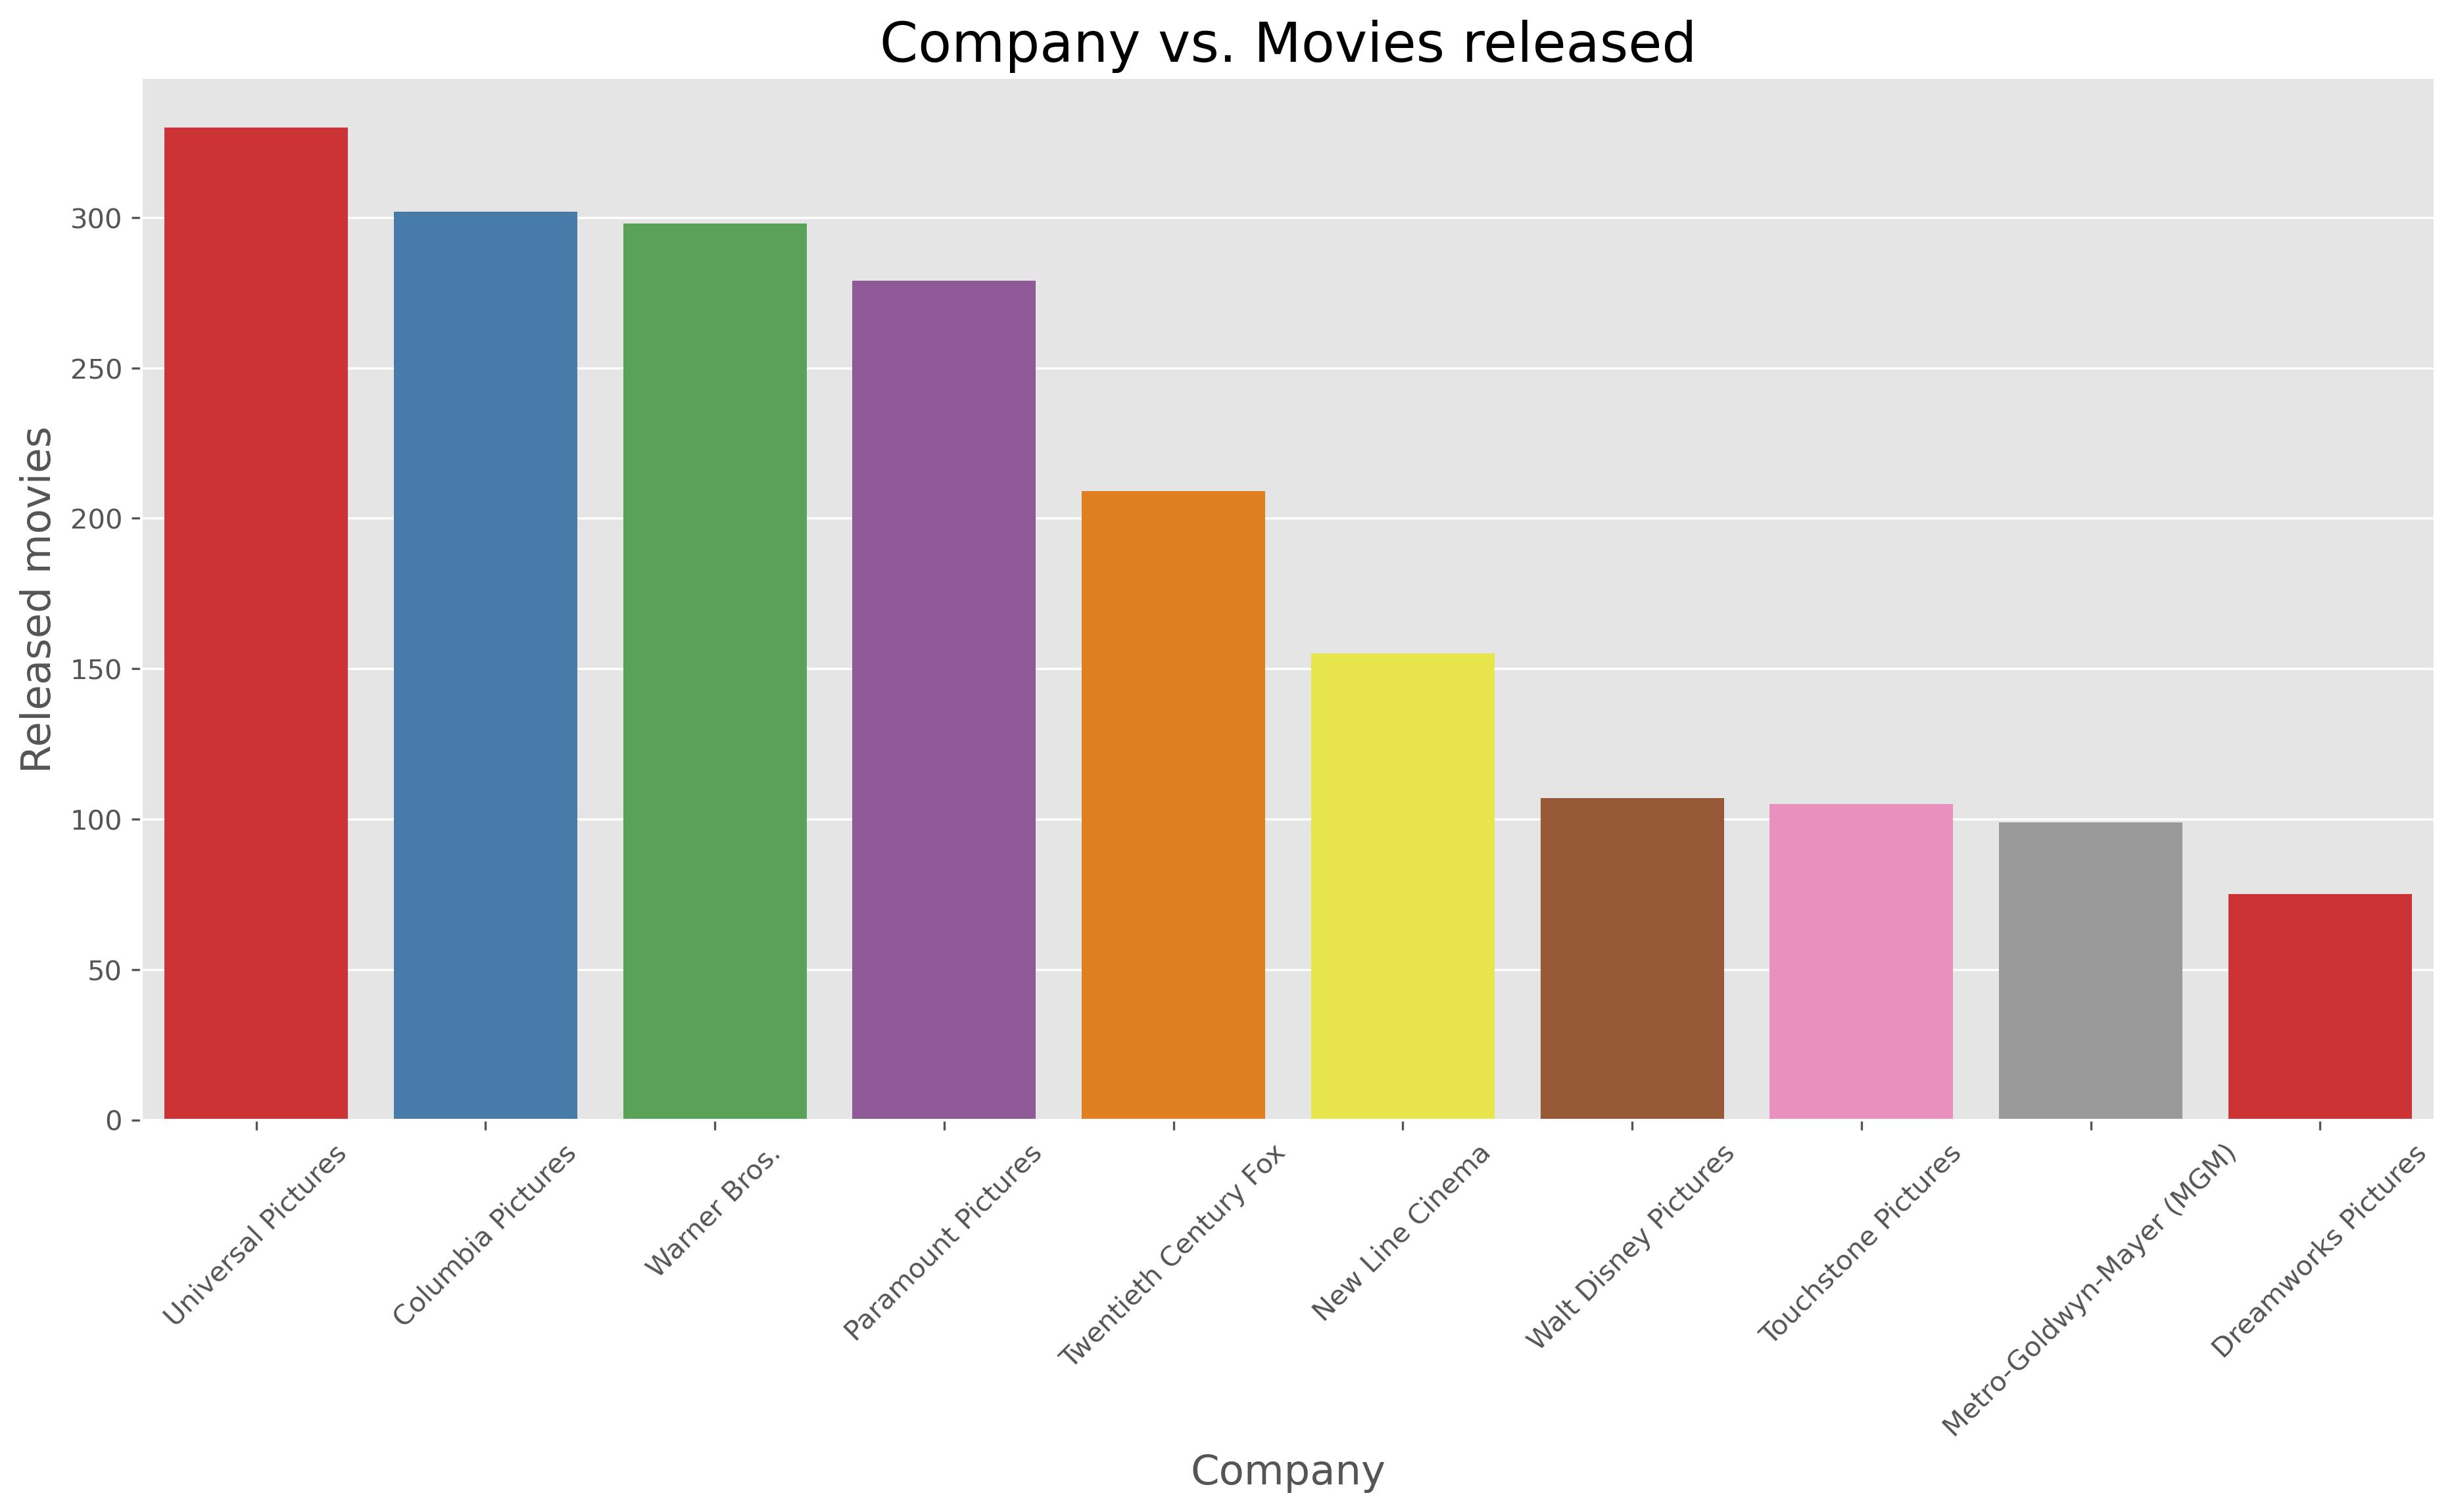
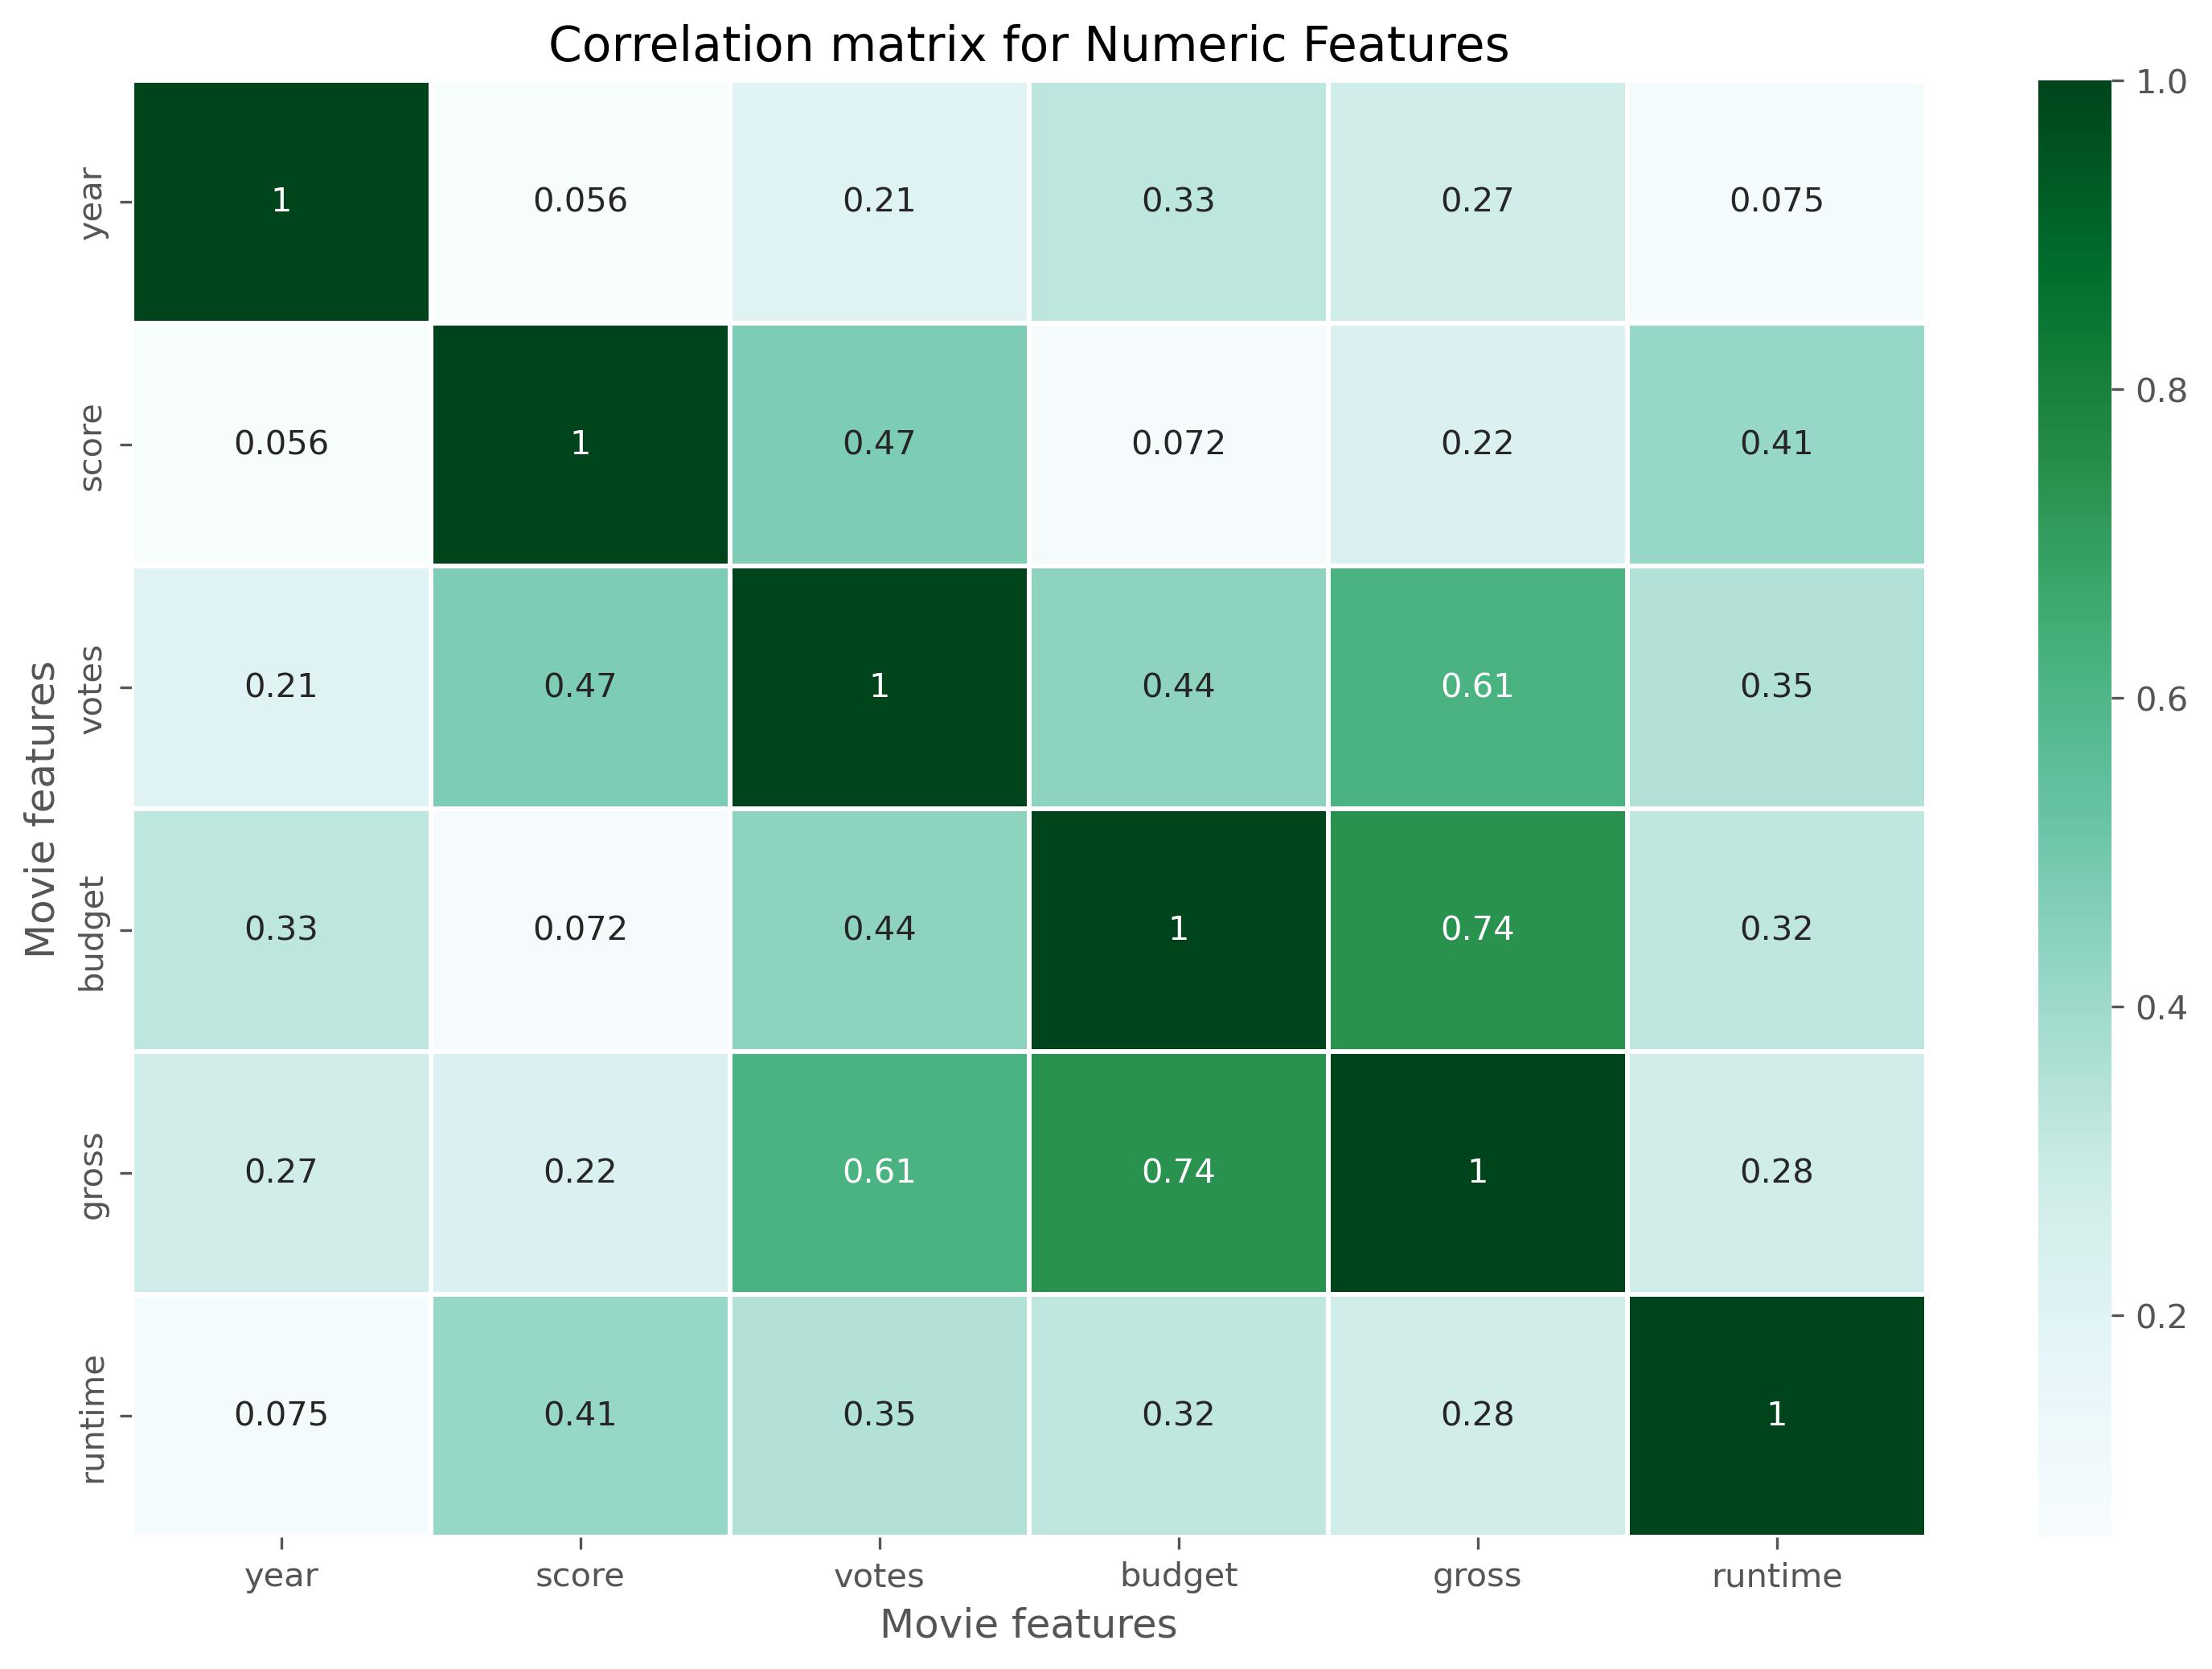
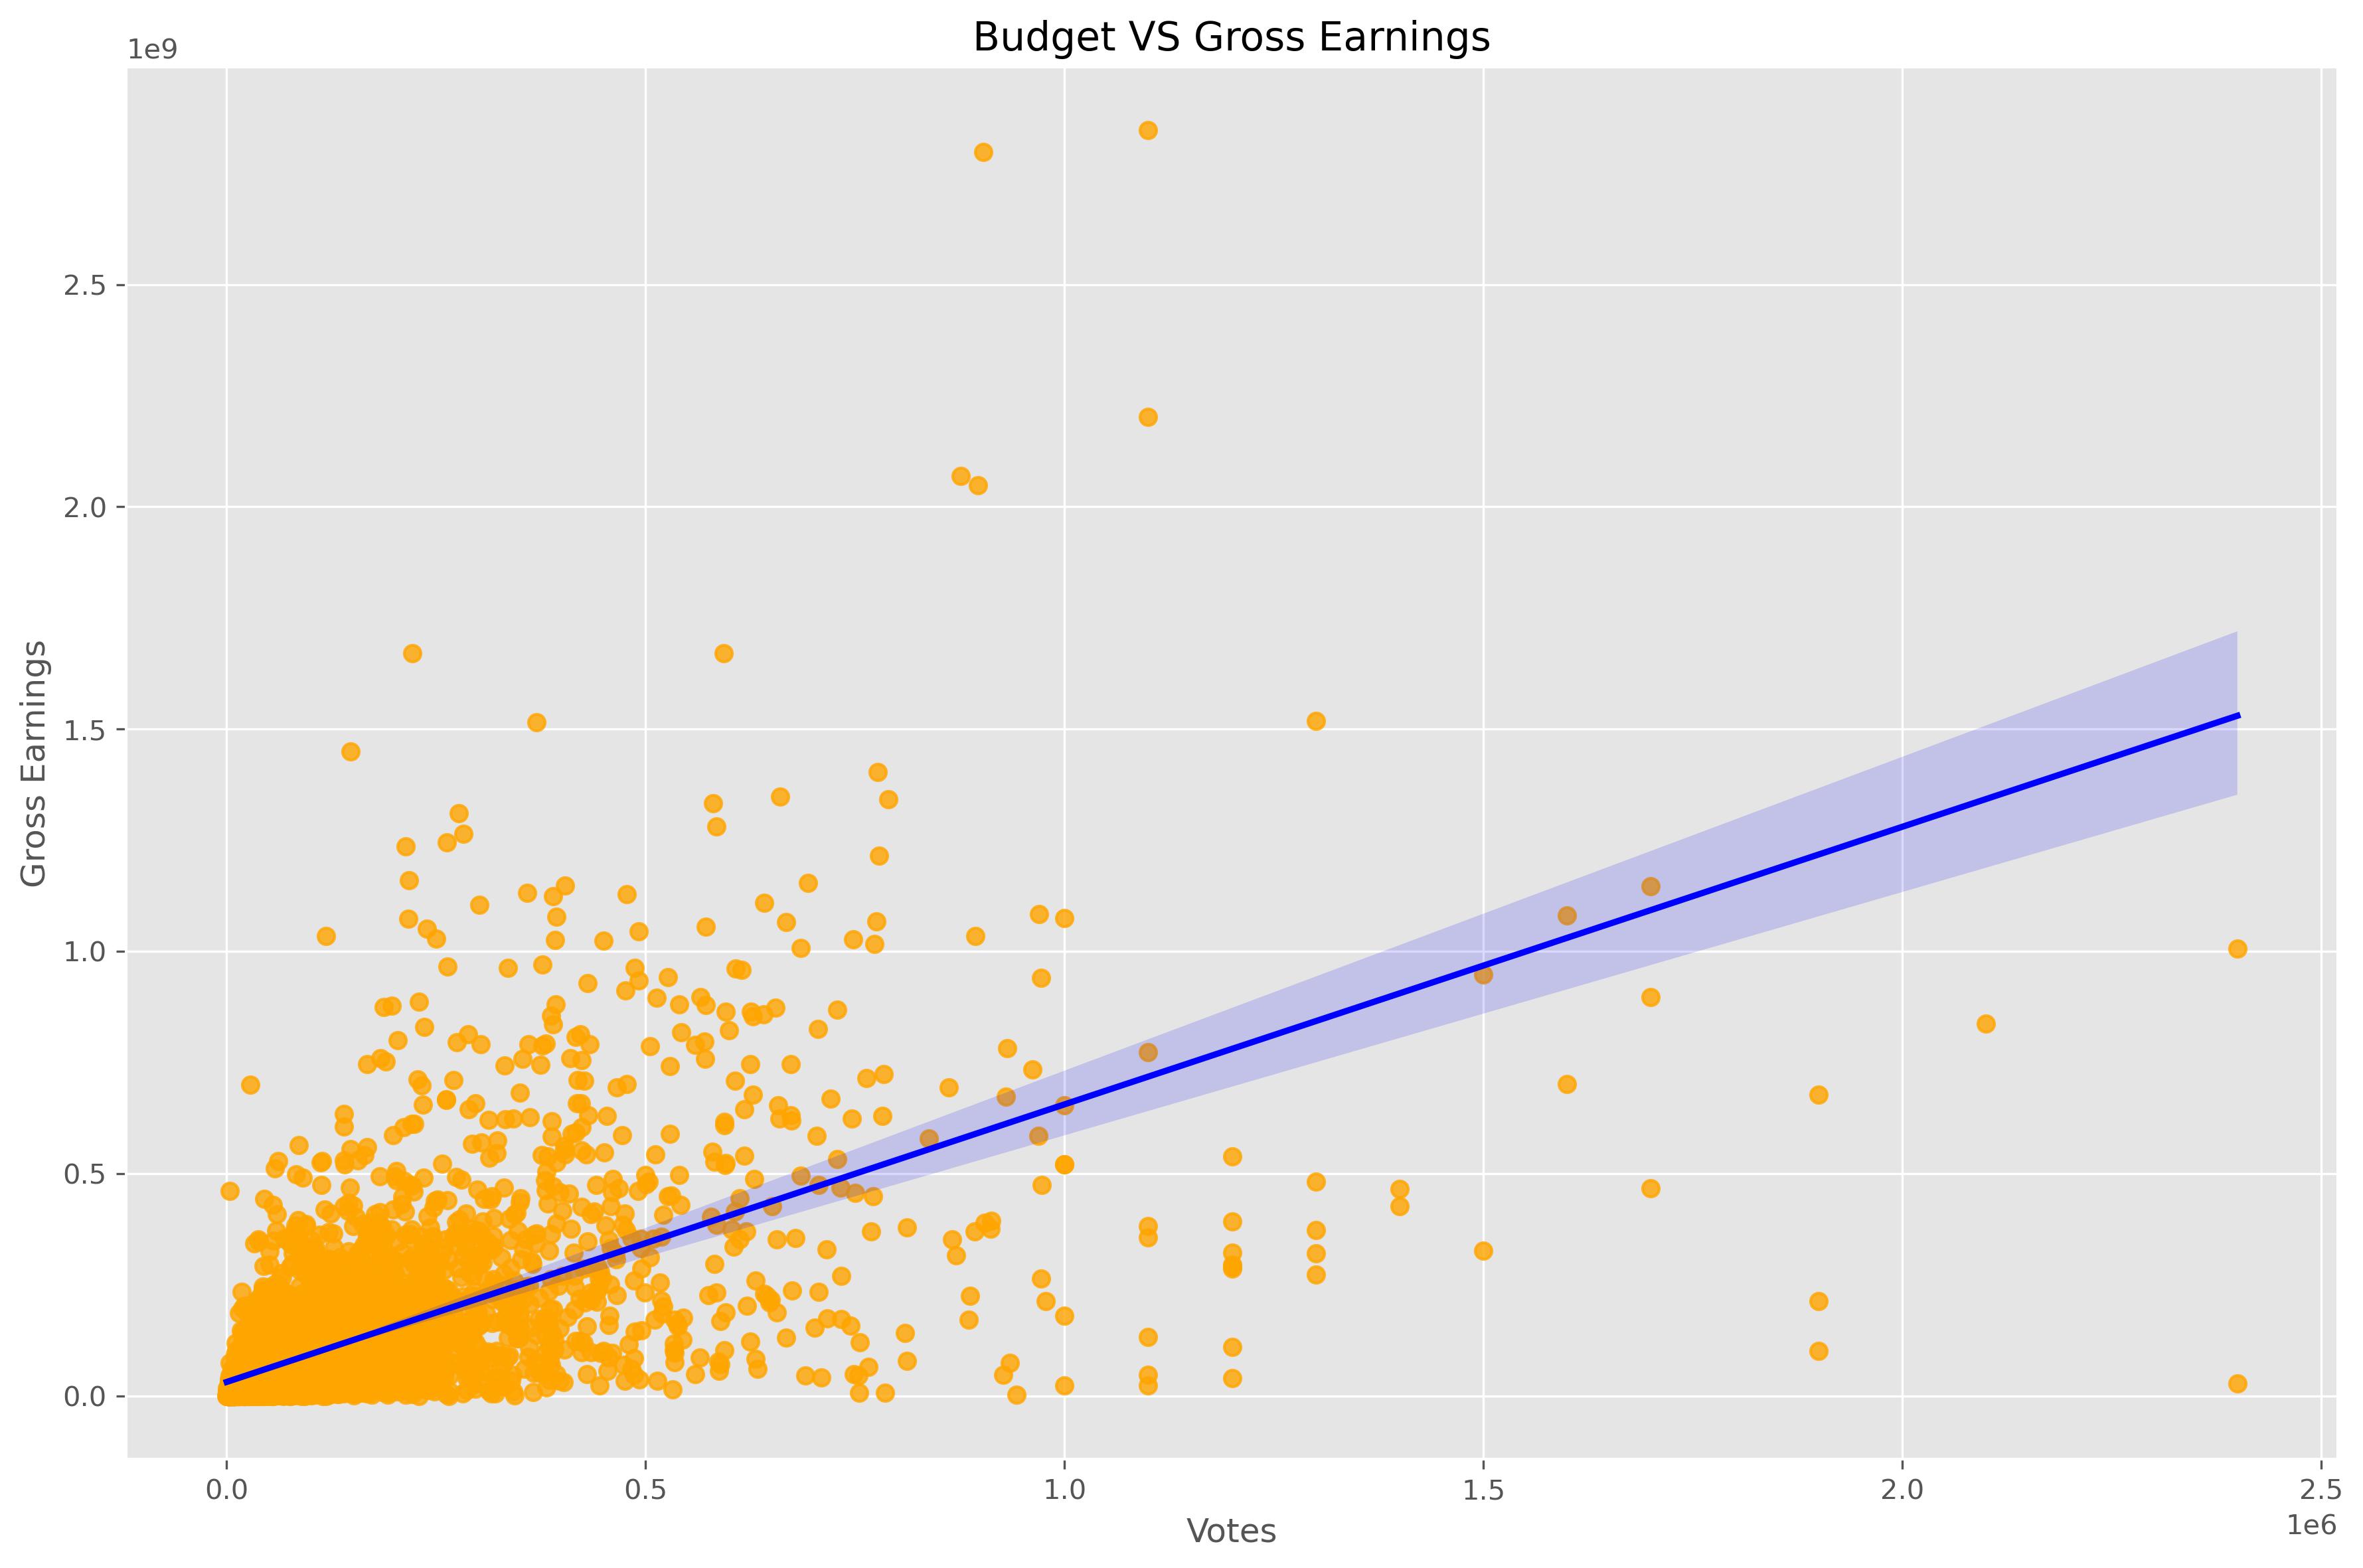
Project 5: Movie Industry Descriptive Analysis
- Used Python ‘Jupyter Notebook’ to do the analysis
- Explored, Cleaned, Visualized, and got conclusions
- Created new columns and checked it credibilty
- Check data that the data is not bais
- Found insights from the data
- Descriptive statistics findings
Some of the Visualization made on Jupyter Notebook you can see all the Code on Kaggle thourgh this link